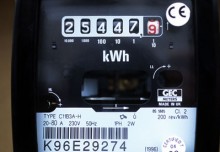
If you’re looking for your energy to be greener, how do two of our major suppliers stack up when it comes to eco credentials? E.on and Npower are two of the ‘big six’ – the largest power suppliers in the UK. Npower, with 3.1 million customers, supplies around 10% of UK electricity, while E.on supplies 5 million domestic and commercial customers.
Information about energy companies can be complex to get to grips with, but published data enables us to make a quick comparison of headline green credentials. Also worth considering are future commitments and the corporate culture of the companies as the energy mix evolves.
First, then, we’ll look at the fuel mix currently used for electricity generation which includes current renewable capacity:
Fuel mix April 2014 – March 2015
| Fuel type | Npower | E.on | UK average |
| Coal | 21% | 33.9% | 26.7% |
| Natural Gas | 59% | 31.7% | 29.7% |
| Nuclear | 2% | 12.4% | 22.2% |
| Renewable | 17% | 16.5% | 19.3% |
| Other | 1% | 5.5% | 2.1% |
Using a straightforward comparison, Npower favour natural gas and source only a small proportion of their power from nuclear. E.on are way above the UK average for coal generation and source over 12% from nuclear. Both companies are keen to promote their renewable commitments – but still fall slightly short of the UK average for renewable power. So looking at solely at the energy mix, the company you deem to be sourcing the greenest power will depend on the position you take on the relative environmental merits of coal, gas and nuclear.
Managing pollution
Pollution produced by generation is largely dependent on power sources, and to a lesser extent on technologies used to clean up emissions or waste. Both companies are investing in cleaner technologies – but there’s no getting away from the fact that continued use of coal leads to the release of more carbon dioxide. The table below shows pollutant emissions for the two companies.
Pollutant emissions from power generation April 2014 – March 2015
| Pollutant | Npower | E.on | UK average |
| Carbon dioxide | 418 grams per KWh | 956 grams per KWh | 368 g per KWh |
| Radioactive waste | 0.00013 grams per KWh | 0.002 grams per KWh | 0.00155 grams per KWh |
E.on produced twice as much pollution as Npower from its power generation and more radioactive waste.
Corporate eco commitments
According to Npower’s own blurb “We are one of only a handful of UK companies to have been awarded the Carbon Trust Triple Award for sustainable management of energy, waste and water.” The Npower annual report for 2014 – 15 boasts the company is on track to reduce carbon emissions 80% by 2050.
By 2014 it had also reduced carbon emissions from its offices by 50% compared to 2008.
E.on meanwhile say that they’re ‘improving’ their gas, coal and oil-fired power stations and producing more energy from renewables like wind and water. They’re planning to increase their renewable capacity by at least 1,500MW ‘soon’, for example as a partner in the Rampion wind farm off the Sussex coast and in the building of the London Array, the world’s largest offshore wind farm. They’ve also been testing a wave power device in UK waters and are supporting research into advanced methods to reduce carbon emissions.
In summary, it looks like Npower currently have the environmental edge over E.on in terms of fuel mix and emissions, and clearer stated commitments to meeting environmental targets.


